Lean Agentic ObservabilityCollect only what brings value.
Metrics, logs, and traces — one agent, one lean pipeline. You pay nothing for telemetry
until a dashboard, an alert, or a custom rule of yours actually needs it, and only for
as long as it needs it.
Free tier with generous limits. No credit card, no time limit.
Why LeanSignal
How we bring more Value for less Cost
Legacy observability vendors all give the same advice: store everything
now, worry about the bill later. Follow it and you end up in The Pain Cycle.
The Observability Pain Cycle
High bills drive the telemetry filtering.
Telemetry Data FlowControl Flow
LeanSignal applies lean principles to observability.
Demands — not defaults tuned for the vendor's profit — decide what gets collected, and the loop starts
running in your favor: The Value Cycle.
The Observability Value Cycle
Value drives the telemetry filtering.
Telemetry Data FlowControl Flow
So what do the two cycles cost over time? Applying lean principles
flips the cost dynamics completely — away from favoring your vendor,
toward favoring you.
The Cost of Pain and Value Cycles
Legacy store everything vs. Demand-Driven Observability.
The Pain CycleThe Value Cycle
The result: an order-of-magnitude cost advantage when you start, and an
expected 2× advantage over the best legacy observability setups.*
And one more thing: Lean saves trees 🌳
Agentic observability
Meet LeanBuddy — Your AI Teammate
Meet LeanBuddy, your on-call sidekick
Ask in plain language — "why is p99 up since 14:00?" — and LeanBuddy investigates for real: it queries your live metrics, logs, and traces, explains what changed, and hands you deep links straight to the evidence. It even knows what you are NOT collecting, and says so instead of guessing.
Production telemetry, in your IDE
Connect Claude Code, Cursor, or VS Code to your tenant over MCP with one personal token. Ask about production while you write the fix — the metrics, logs, and traces behind an incident are one question away from the code that caused it. These questions run on your regular AI subscription, not on your LeanBuddy budget.
Your agent ships the observability too
Opt a token into write access and the same agent that instruments your code declares the demand, builds the dashboard, wires the alert, and test-fires it against live data — before the pull request merges. The change and its observability ship as one motion, not a follow-up ticket.
AI on signal, not noise
Because the pipeline stores only demanded telemetry, the AI reasons over a small, relevant dataset instead of digging through a haystack. That means sharper answers, fewer tokens, and lower cost per question.
Every answer has a receipt
LeanBuddy shows the queries it ran and what each answer cost, and it works within a spending budget you set. You can always see where an answer came from and what you paid for it.
Scoped, audited, revocable
Tokens are read-only by default; writes are an explicit opt-in, deletes a separate one. Every AI-made change runs under your role, passes the same validation as the app, and lands in the audit log marked as agent work. One click revokes it all.
Features
Demand drives the pipeline
Demand governs the pipeline
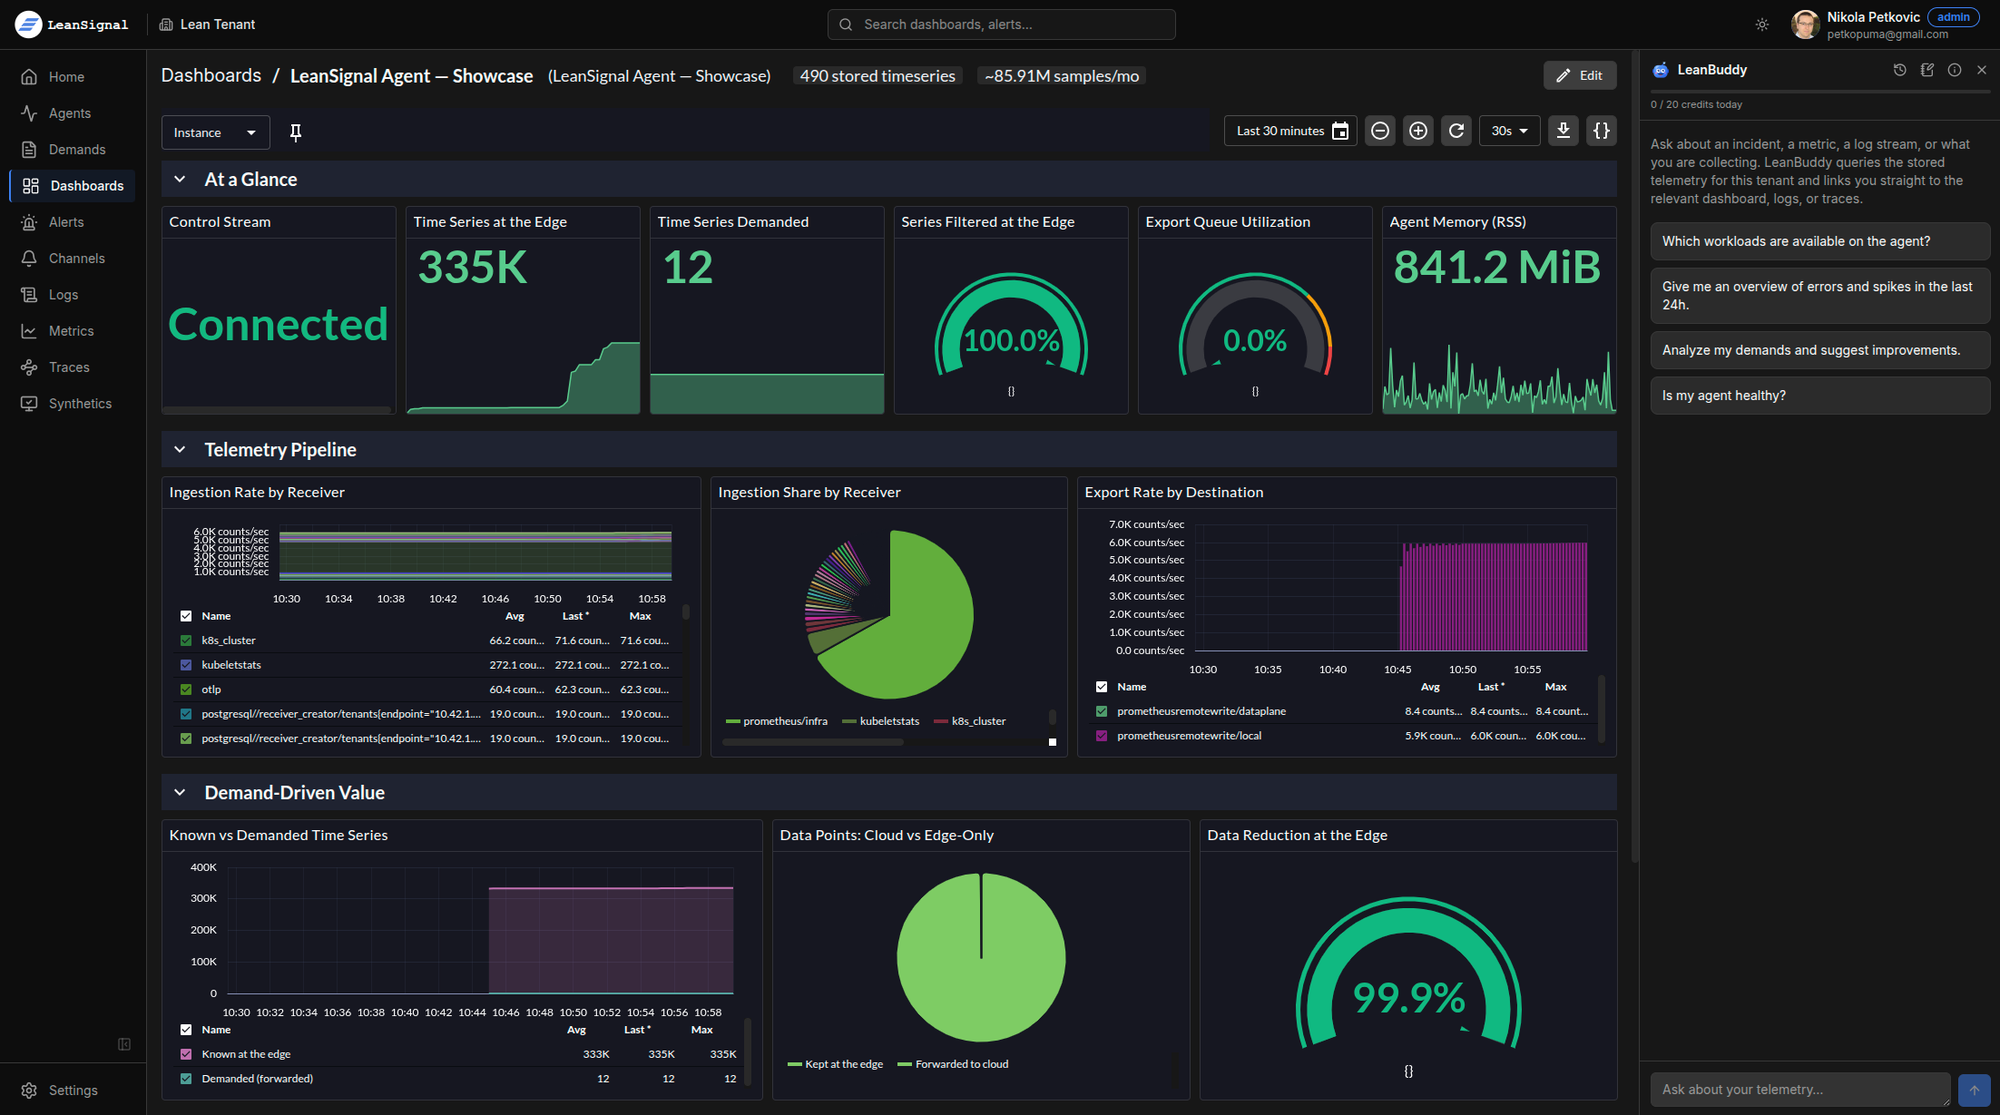
You declare the signals you need. Demand — not supply — decides what gets collected, so noise is eliminated from day one instead of pruned after the bill.
A cost–value link, always in sync
Every signal is tied to the need it serves. You can finally see which spend buys which value — and cut the noise with confidence.
Filtered at the source
Telemetry is indexed and filtered at the edge, before it ever reaches storage — no more choosing between storing everything and whitelisting blindly.
From the PAIN cycle to the VALUE cycle
Escape the store-everything, bill-shock, reactive-pruning loop. Start at zero and grow cost and value together as your needs change.
One agent, three signals
Metrics, logs, and traces
The same demand model across all three signals, each defined and explored in the query
language you already use.
Metrics
PromQL
Every metric your agents collect, explored with the Prometheus query language you already know. Graph it before it is ever a demand, then pin what matters to a dashboard or an alert.
Logs
LogQL
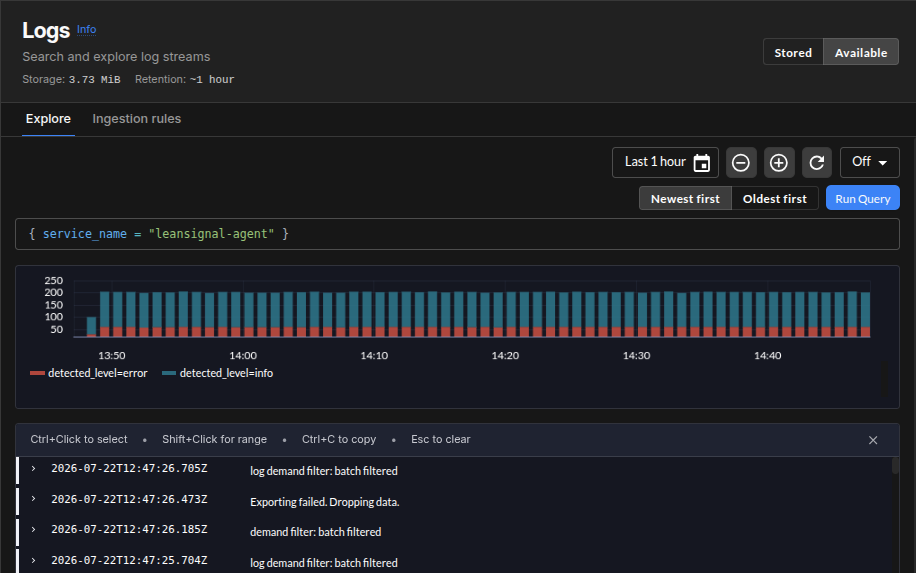
Search structured logs with LogQL. Agents keep everything locally and forward only the streams you demand — grep the edge live, store just what earns its place.
Traces
TraceQL
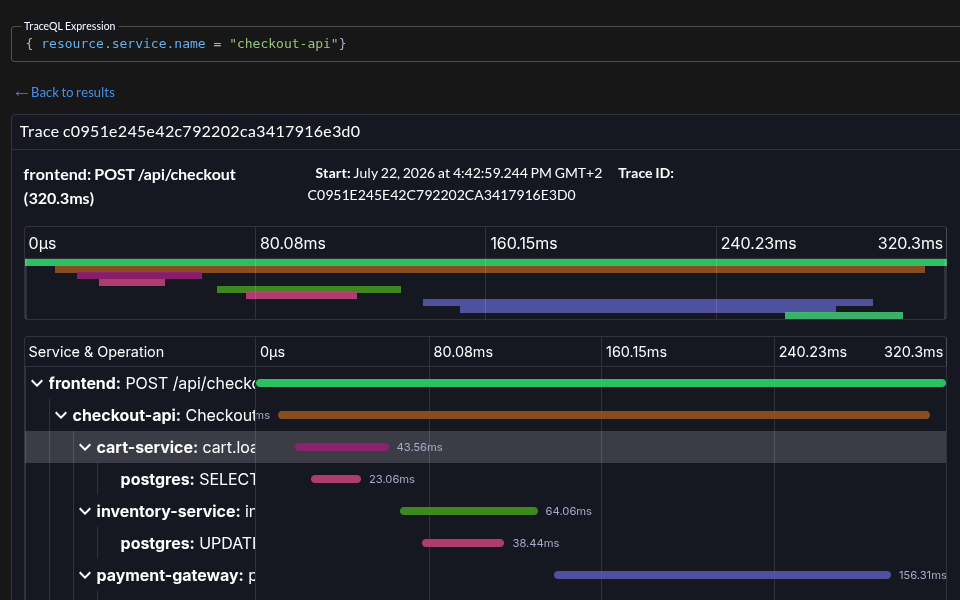
Follow a request across services with TraceQL. Demand is service-scoped: name the services you care about, and their traces are stored in full, ready to inspect span by span.
Capabilities
More than dashboards
Alerts & notifications
Alert on any PromQL condition and route firing and recovery to email or Slack. A rule lives inside the demand it belongs to, so alerting on a metric turns its collection on automatically.
Synthetic monitoring
Scheduled HTTP checks watch your endpoints from the outside. After a set number of failures a check flips to Failed and notifies the same channels as your alerts — recovery included.
Custom rules
Go beyond dashboards: author your own metric, log, and trace rules in each signal’s query language to declare exactly what to forward — no dashboard required.
Dashboards & versioning
Build Perses dashboards that double as demand: the panels you save decide what gets collected. Every change is versioned, exportable, and portable between tenants.
User management
Add an unlimited number of users to your tenant, a standalone instance of the observability stack that is yours alone. Admin, editor, and viewer roles keep everyone working with the right permissions.
Tenant management
Create multiple tenants and isolate telemetry by environment, stage, or any criteria you see fit. Each tenant is its own standalone stack, so the workloads never mix.
The leanctl CLI
Manage your tenant from the terminal with the open-source leanctl. Demands, dashboards, alerts, and more work as commands, ready for scripting and CI.
Single sign-on
Sign in with email and password, Google, GitHub, or your own identity provider. Custom SSO integration is available even on the free plan.
Ready-made integrations
Curated bundles for PostgreSQL, MySQL, AWS CloudWatch, host metrics, and the major language runtimes. One import brings the dashboards and their demands together, so a new integration works in minutes.
Dark & light themes
The console ships with polished dark and light themes. Pick what suits your eyes or your room — your choice sticks across sessions.
Built on open standards
OpenTelemetry
Prometheus
Perses
VictoriaMetrics
Loki
Tempo
Security, isolation & privacy
Single-tenant, open, and compliant by design
Single-tenant by design
Your tenant is its own isolated stack — its own storage, its own compute. No noisy
neighbours, so performance stays predictable, and your data never shares a table with
anyone else’s. Isolation is the default, not an upsell.
Auditable by design
Every critical change — demands, agents, checks, retention, users — is captured in a
per-tenant audit log. Who changed what, and when, is always answerable, so changes stay
accountable and compliant.
Open-source agent
The LeanSignal agent is a fully open-source distribution of the OpenTelemetry
Collector. It includes the components that establish connectivity with our backend
and enable Demand-Driven Observability, and you can read, audit, and build every
line of it. No proprietary black box and no hidden data paths.
Compliant data handling
Your telemetry is processed and stored in line with the GDPR and strict
data-protection rules — you always know where your data lives and who can touch it.
Free service
Start on the Free Tier
Generous limits, no credit card, no time limit.
Free$0/mo
100 GBlogs ingested / month
80 GBlogs stored
10 Billionmetric points ingested / month
40 GBmetrics stored
50 GBtraces ingested / month
40 GBtraces stored
100,000synthetic check runs / month
30 daysdata retention — all signals
Sign-inemail & password, Google, GitHub, or your own custom SSO
Your Usage page shows exactly where you stand against every limit. Reach one and
ingestion simply pauses — no overage, no surprise bill. Monthly budgets reset on
the 1st.
Outgrowing the free tier?
Get in touch
and we’ll set you up with a plan that fits.
Ready to run Lean Observability?
Sign up, install our OpenTelemetry-based LeanSignal agent, and start collecting the telemetry that
actually matters.
 Meet
Meet 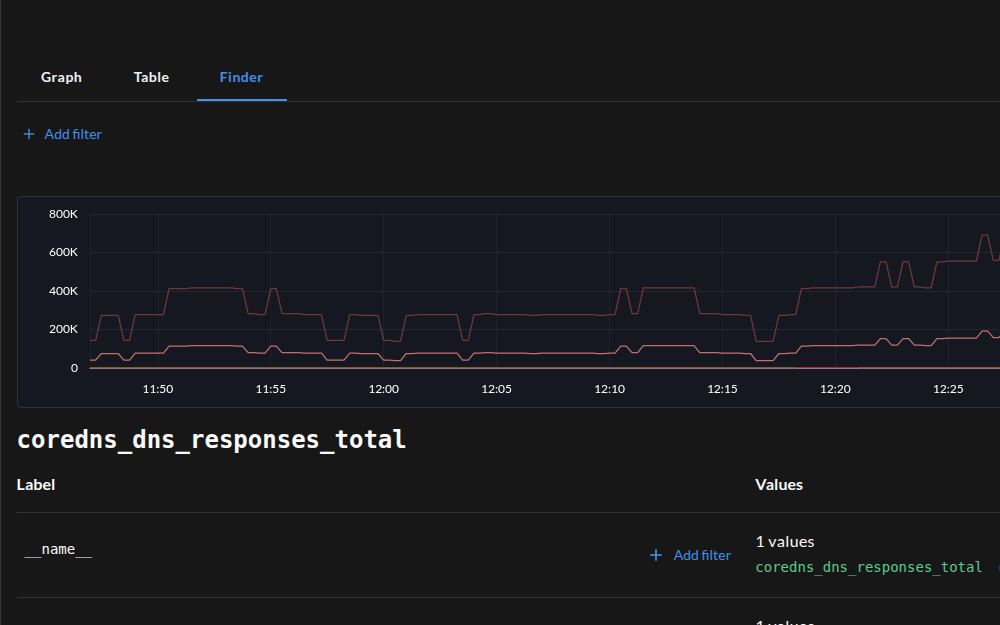
 OpenTelemetry
 Prometheus
 Perses
 VictoriaMetrics
 Loki
Loki
 Tempo
Tempo